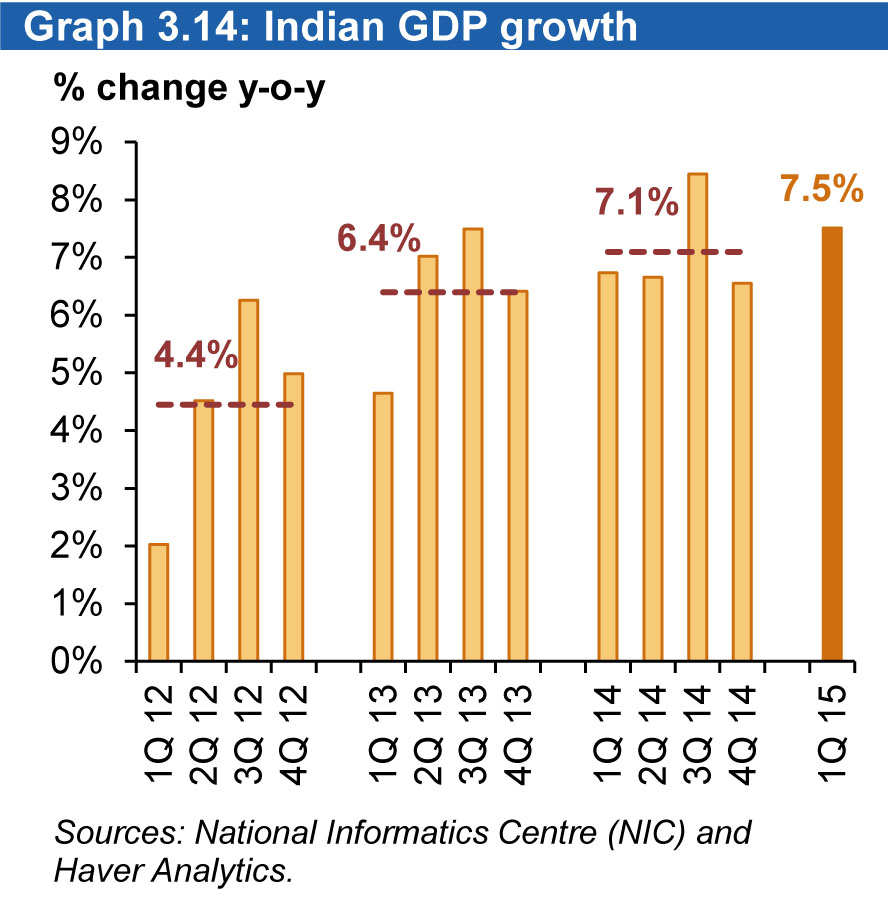
India
India’s economy grew 7.5% in the 1Q15, which was above expectations. It grew 7.3%
during the fiscal year ending 31 March. This means the country has outpaced China’s
economic expansion for two quarters out of the last three. It seems key positive
aspects are low commodities – and, specifically, low oil prices – which will limit the
current account deficit and lower inflation. Indeed, wholesale price inflation was
negative for the sixth consecutive month in April, while CPI inflation fell to a four-month
low. This will support consumers’ purchasing power and encourage spending.
When GDP components are investigated, on the demand side GDP has improved
visibly in January–March, while real private consumption spending grew 7.9% y-o-y,
the highest in seven quarters. Although this is in line with the notion of easing inflation
and lower interest rates supporting consumer spending (the CPI averaged 5.3% y-o-y
in January–March compared with 7.8% y-o-y during the same quarter last year), this
robust expansion contradicts much weaker data on consumer goods output,
particularly of consumer durables, which continued to contract in y-o-y terms. In the
meantime, real fixed investment grew 4.1% y-o-y, recovering from 2.4% y-o-y in the
4Q14 and bringing the annual average to 4.6%. Investment goods output expanded by
a respectable 9.6% y-o-y during the quarter and the imports of capital machinery grew
at double digits. The new investment announcements also increased 88% y-o-y during
the 1Q15. Despite the gradual improvement in demand-side GDP, the gross value
added data showed a steep decline in the 1Q to 6.1% y-o-y, bringing the annual
average to 7.2%. Here again, the government data showed a strong expansion in
manufacturing and financial and transport services, which grew 8.4% y-o-y, 10.2%
y-o-y and 14.1% y-o-y, respectively
The inflation rate in India was recorded at 4.87% in April of 2015. The CPI in India
increased to 120.7 index points in April 2015 from 120.2 index points in March. Since
the last RBI review in early April, oil prices have risen nearly 10% and the rupee has
depreciated nearly 3%. However, the baseline arguably had some associated
downside risks, and while the current move in oil prices and the value of the rupee are
likely to offset those risks and increase inflationary pressures, by themselves they are
unlikely to push inflation above the RBI’s 6% January 2016 target. Food inflation eased
to 6.14% in March from 6.88%, while the core part of the CPI remained largely sticky at
4.15% versus 4.10% in February. The prices of food and beverage items eased to
6.20% from 6.76%. The actual nature of the monsoons will be clear only around
mid-July. While a good monsoon can somewhat mitigate the impact of the unseasonal
summer rains on food prices, a bad one can do more damage. A much bigger worry is
a strong monsoon season that could drive up food prices. But there are mitigating
factors. The y-o-y deflation in WPI prices accelerated to 2.7% y-o-y in April from a 2.3%
rate in March. On a sequential basis, prices dropped for the seventh time in eight
months, declining by a seasonally adjusted (SA) rate of 0.5% m-o-m. The WPI has a
much larger tradable component than the CPI and, therefore, has been much more
responsive to the recent global commodity price fall. April was no different, with fuel
prices declining by a SA rate of 1.9% m-o-m on the back of pump price cuts at the end
of March. Furthermore, minerals prices declined by a SA rate of 0.8% m-o-m, reflecting
soft commodity prices. However, WPI deflation does not only reflect the first-round
impact of commodity prices. Falling input costs, weak domestic demand, and excess
capacity in key manufacturing sectors meant that core prices also declined sequentially
for the sixth straight month in April, falling by a SA rate of 0.2% m-o-m. As a
consequence, y-o-y core inflation remained unchanged in negative territory at -0.4%
y-o-y. India’s central bank cut its main interest rate by 0.25 basis points (bp) for the
third time this year, a move that appears at odds with recent data showing the country’s
economy has accelerated to become one of the fastest-growing in the world, with the
repo rate now at 7.25%.
Graph 3.16: Indian current account
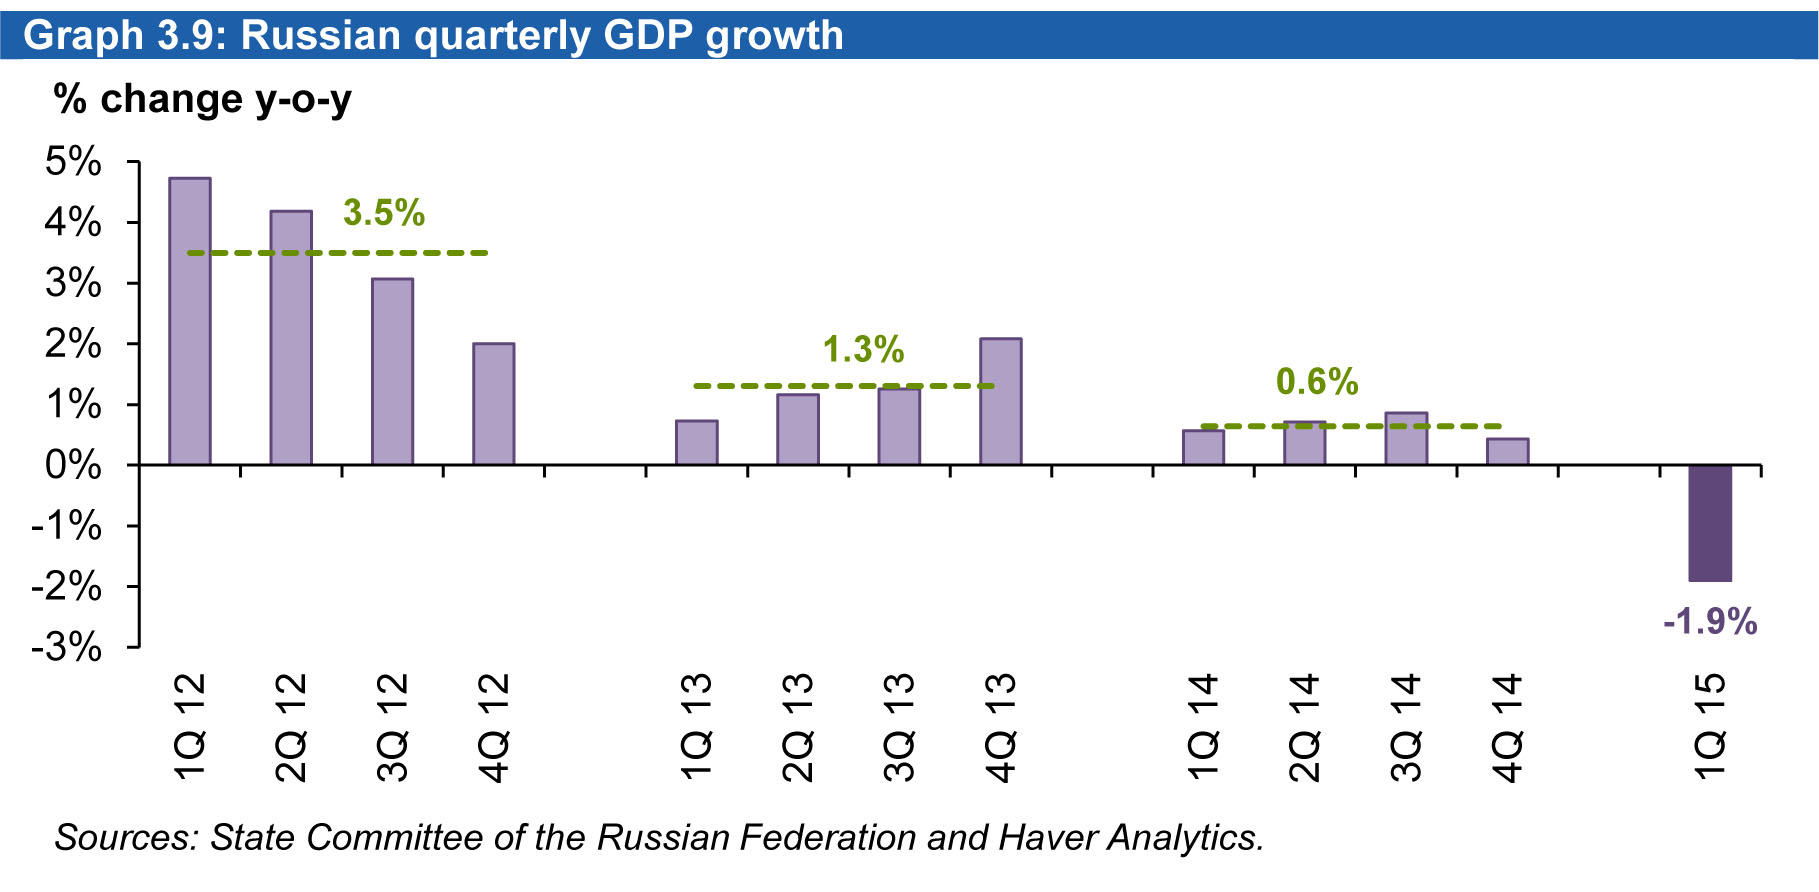
Russia
The GDP contracted 1.9% y-o-y in 1Q15, better than most expectations. Though
details about GDP components have not been released yet, data showed imports fell
by approximately 39% y-o-y in the same period, which is likely the reason behind the
better-than-expected
Inflation decreased to 15.8% y-o-y in May, easing slightly from 16.4% in April. In May,
the central bank reduced its benchmark interest rate to 12.5% from 14% in April.
Industrial production contracted 4.5% y-o-y in April, registering the third consecutive
deceleration. The drop in retail sales accelerated further in April, falling 9.8% y-o-y
from an 8.7% dip in March. Retail sales were in contraction for four months in a row
through April when they hit a record low reading. The unemployment rate in April
posted its first modest easing in seven months, standing at 5.8% in April from 5.9% a
month earlier. re.
Graph 3.9: Russian quarterl
